Telemetry — Agent Logs and Metrics
Introduction
Telemetry is the pipeline that moves logs and metrics from devices to the GetApp server so they can be searched, charted and — for installations — watched live from GetApp Platform.
On the device, the agent gathers four kinds of data:
| Source | What it is | Telemetry topic |
|---|---|---|
| Agent logs | The agent's own log (agent*.log) | agent |
| Deployment (component) logs | The per-release deploy log written while a component is installed, updated or removed | The component's catalog id, e.g. 52.orchestrator-test@1.0.0 |
| Third-party logs & metrics | Anything a local application reports to the agent through its local API | Chosen by the reporting app |
| System metrics | CPU, memory, disk and network usage sampled by the agent | agent |
All data is written to a local SQLite store first (telemetry.db), then sent to the server
either on a schedule or immediately (reactive mode). On the server, logs are stored
in Elasticsearch and metrics in VictoriaMetrics.
1. Collecting data on the device
Agent logs
The agent reads its own log files (agent*.log in the logs directory) and parses each
TIMESTAMP | LEVEL | MODULE:LINE — MESSAGE line into a log entry. Only entries at or above
telemetry.log_min_level (default ERROR) are kept. Entries are stored with
group = "agent" and topic = "agent", and module and line are added to metadata.
A watermark (last_log_collect in telemetry.db) records how far collection has read, so
each line is collected only once. On the first run, collection starts one hour back.
Deployment logs — collected per component
Every Deploy V2 run (install, update, uninstall or another lifecycle action) writes a dedicated log file per release in the logs directory:
<logs_dir>/deployments/<catalog_id>.log
The file is UTF-16LE, in the format [<rfc3339>] [<LEVEL>] <module>:<line> — <message>.
For more details, see Deploy V2 — Logging & Status.
Telemetry collects these files per component:
- Every
*.logfile under<logs_dir>/deployments/is scanned. - The file name (without extension) is the catalog id, and it becomes the log entry's
topic, e.g.52.orchestrator-test@1.0.0. You can then query, filter and stream the logs of one component on one device. - Lines are filtered by their own threshold,
telemetry.deploy_log_min_level(defaultDEBUG). Installation logs are therefore sent in full, while the agent log stays atERROR. - Lines that don't match the deploy format are skipped, such as multi-line script stdout or
raw
msiexecoutput. - No duplicates: every deploy line is also mirrored into
agent.log. The collector records a signature of each deploy line (time to the second, level, module, line and message) and skips the mirrored copy inagent.log. Each event is sent once, under its component topic.
Deployment rows are stored with group = "agent" and topic = <catalog id>. At send time,
the agent applies deploy_log_min_level to these rows and log_min_level to all other
rows.
System metrics
When telemetry.metrics_enabled is true, the metrics collection job runs every
telemetry.metrics_collect_interval_mins (default 5) and records:
| Metric | Unit |
|---|---|
cpu_usage | percent |
memory_usage | percent |
memory_used_bytes / memory_total_bytes | bytes |
disk_usage | percent |
disk_available_bytes | bytes |
network_download_kbps / network_upload_kbps | kbps (when a bandwidth sample is available) |
Local storage
All telemetry is buffered in {data_dir}/data/telemetry.db:
| Table | Content |
|---|---|
telemetry_logs | log_id, device_id, log_group, topic, level, message, metadata, logged_at, created_at, sent_at |
telemetry_metrics | metric_id, device_id, topic, name, value, unit, labels, recorded_at, created_at, sent_at |
telemetry_state | Key/value state, e.g. the last_log_collect watermark |
Inserts are de-duplicated by log_id / metric_id. A row is deleted as soon as the
server accepts it. Rows that fail to send stay in the table and are retried later.
2. Sending data to the server
The agent sends telemetry to two server endpoints with its device token:
| Data | Endpoint |
|---|---|
| Logs | POST /api/v2/device/telemetry/logs |
| Metrics | POST /api/v2/device/telemetry/metrics |
Rows are grouped by (deviceId, group) for logs and (deviceId, topic) for metrics. They
are read in pages of telemetry.send_batch_size (default 500) and sent in requests of at
most 50 entries to keep payloads small.
{
  "deviceId": "DEV-1234",
  "group": "agent",
  "logs": [
    {
      "logId": "8f0c…",
      "timestamp": "2026-10-21T10:15:02.120Z",
      "level": "INFO",
      "message": "Task 3/7 'install-service' completed",
      "topic": "52.orchestrator-test@1.0.0",
      "metadata": { "module": "server::common::device_mng::deploy_srv::deploy_v2::task_executor", "line": "214" }
    }
  ]
}
There are two sending modes.
Scheduled mode (default)
The telemetry dispatch job runs every telemetry.send_interval_mins (default 60):
- Collect from disk: gather deployment logs and agent logs written since the
watermark into
telemetry.db. - If nothing is pending above the minimum levels, skip the run.
- Send all pending logs (if
logs_enabled) and metrics (ifmetrics_enabled), page by page. When a request fails, the run stops for that group, and the remaining rows wait for the next run.
The job is registered at agent start-up when logs_enabled or metrics_enabled is true.
Reactive mode (immediate)
With telemetry.reactive_mode: true, logs are captured live and sent as soon as they are
written, while the server is reachable:
- Live capture: the agent's global logger wraps log4rs. Each log record goes to the log
files as usual and is also put on an in-memory queue:
- Agent lines use
topic = "agent"and are filtered bylog_min_level. - Deploy-logger lines use
topic = <catalog id>and are filtered bydeploy_log_min_level. The copy of each deploy line mirrored toagent.logisn't queued again. - Telemetry's own logs and HTTP-client logs are excluded to prevent feedback loops.
- Agent lines use
- Batching: after the first line arrives, a background worker waits up to 300 ms, or until 50 lines are queued, so a burst is sent in one request.
- Wake-ups: the worker also wakes immediately when a third-party app reports logs or metrics, or when the metrics collector stores a sample. Every 5 s it re-reads the settings, so turning reactive mode on or off takes effect without a restart.
- Online/offline aware: the worker sends only when the server connection state is
Connected. Offline, rows stay intelemetry.db, and the scheduled dispatch job (or the reactive worker after reconnection) sends them later. - Back-off: a failed send retries after 30 s, doubling up to 5 min, with ±20% jitter so a fleet doesn't retry at the same moment. A new connection resets the back-off.
- Overflow protection: the queue holds 10,000 lines. If it fills up, capture pauses. When the queue drains, the missing time window is back-filled from the log files on disk, so no lines are lost.
In reactive mode, the scheduled job doesn't read the log files (lines are already captured
live). It still runs as a safety net and sends anything left in telemetry.db.
For live installation logs in GetApp Platform, enable logs_enabled and reactive_mode on
the device. In scheduled mode, logs reach the server only once every send_interval_mins.
CDN / managed devices
A CDN (master) agent also exposes the server contract
POST /api/v2/device/telemetry/logs|metrics. Child agents that can't reach the server
send their telemetry to the master agent. The master agent stores the rows under the
child's deviceId and forwards them upstream like its own. See
CDN Configure.
Telemetry settings
All keys live in the agent's config.yaml. You can set them locally, through environment
variables, or remotely from the server through the
getapp_config reserved group.
| Key | Env var | Default | Description |
|---|---|---|---|
telemetry.enabled | TELEMETRY_ENABLED | true | Master switch |
telemetry.logs_enabled | TELEMETRY_LOGS_ENABLED | false | Collect and send logs |
telemetry.metrics_enabled | TELEMETRY_METRICS_ENABLED | false | Collect and send metrics |
telemetry.reactive_mode | TELEMETRY_REACTIVE_MODE | false | Send immediately while online instead of only on the schedule |
telemetry.send_interval_mins | TELEMETRY_SEND_INTERVAL_MINS | 60 | Scheduled dispatch interval |
telemetry.log_min_level | TELEMETRY_LOG_MIN_LEVEL | ERROR | Minimum level for agent logs and third-party logs |
telemetry.deploy_log_min_level | TELEMETRY_DEPLOY_LOG_MIN_LEVEL | DEBUG | Minimum level for deployment (component) logs |
telemetry.send_batch_size | TELEMETRY_SEND_BATCH_SIZE | 500 | Rows read from telemetry.db per page |
telemetry.metrics_collect_interval_mins | TELEMETRY_METRICS_COLLECT_INTERVAL_MINS | 5 | System-metrics sampling interval |
telemetry.backup_retention_hours | TELEMETRY_BACKUP_RETENTION_HOURS | 48 | Retention for already-sent rows. Sent rows are currently deleted right after a successful send. |
Example getapp_config group that turns on live installation logs for a device:
telemetry:
  logs_enabled: true
  metrics_enabled: true
  reactive_mode: true
  log_min_level: WARN
  deploy_log_min_level: DEBUG
The scheduled dispatch and metrics collection jobs are registered when the agent
starts. If you enable logs_enabled / metrics_enabled remotely on a device where both were
off, the reactive worker picks up the change within seconds. The scheduled jobs start after the
next agent restart.
3. Reporting logs and metrics from third-party tools
Any application on the device can send its own logs and metrics through the agent's local
API (default port 2220). The agent stores them in telemetry.db and forwards them with
everything else. Tools don't need server credentials or connectivity.
POST /api/v2/telemetry/logs
curl -X POST http://localhost:2220/api/v2/telemetry/logs \
  -H "Content-Type: application/json" \
  -d '{
    "group": "my-app",
    "logs": [
      {
        "timestamp": "2026-10-21T10:15:02Z",
        "level": "ERROR",
        "message": "Connection to PLC timed out",
        "topic": "my-app.plc",
        "metadata": { "retry": 3, "host": "10.0.0.5" }
      }
    ]
  }'
| Field | Type | Required | Notes |
|---|---|---|---|
deviceId | string | no | Empty means the agent's own device id |
group | string | no | Batch-level bucket that groups multiple topics. Stored as null when absent (shown as ungrouped on the server). |
logs[].logId | string | no | Idempotency key. A UUID is generated when absent. Re-sending the same id is ignored. |
logs[].timestamp | RFC 3339 date-time | yes | When the line was produced |
logs[].level | DEBUG | INFO | WARN | ERROR | FATAL | yes | |
logs[].message | string | yes | |
logs[].topic | string | no | Source of the line. Defaults to group, then to agent. |
logs[].metadata | object | no | Free-form key/value pairs |
Response: 200 OK with { "ingested": <rows inserted> }. A malformed body returns 400.
POST /api/v2/telemetry/metrics
curl -X POST http://localhost:2220/api/v2/telemetry/metrics \
  -H "Content-Type: application/json" \
  -d '{
    "topic": "my-app",
    "metrics": [
      { "timestamp": "2026-10-21T10:15:00Z", "name": "queue_depth", "value": 42, "unit": "items",
        "labels": { "queue": "orders" } }
    ]
  }'
| Field | Type | Required | Notes |
|---|---|---|---|
deviceId | string | no | Empty means the agent's own device id |
topic | string | no | Defaults to agent |
metrics[].metricId | string | no | Idempotency key, auto-generated when absent |
metrics[].timestamp | RFC 3339 date-time | yes | |
metrics[].name | string | yes | e.g. queue_depth |
metrics[].value | number | yes | |
metrics[].unit | string | no | e.g. percent, bytes, ms |
metrics[].labels | object | no | Extra labels, which become VictoriaMetrics labels on the server |
- Reported data reaches the server only if
telemetry.logs_enabled/metrics_enabledistrueon the device. - Third-party logs are filtered by
telemetry.log_min_level(defaultERROR) at send time. Lower the level if you needINFO/WARNlines on the server. - Don't use
group: "agent"with a custom topic. The agent reserves that combination for deployment logs, sodeploy_log_min_levelwould be applied instead. - In reactive mode, a report wakes the sender immediately, so the lines appear on the server (and in live views) within seconds.
4. Storage on the server
Ingestion path
- The API service receives
POST /api/v2/device/telemetry/logs|metricsand emits the batch on Kafka (getapp-deploy.ingest-logs/getapp-deploy.ingest-metrics). It doesn't store anything itself. - The Deploy service consumes the event and writes it to the storage backend.
- Each API replica also consumes
ingest-logswith its own consumer group to feed live SSE clients (see section 6). In socket (non-Kafka) mode, the Deploy service forwards each stored batch to the API onLOGS_INGESTEDinstead.
Logs → Elasticsearch
| Item | Value |
|---|---|
| Index | getapp-logs (1 shard, 0 replicas, created automatically at start-up) |
Document _id | <deviceId>_<logId>, so re-sent lines overwrite instead of duplicating |
| Fields | logId, deviceId, group (ungrouped when absent), topic (agent when absent), timestamp, level, message (full-text), metadata, ingestedAt |
| Connection | ELASTICSEARCH_NODE (e.g. http://elasticsearch:9200). When unset, logs are dropped with a warning. |
Metrics → VictoriaMetrics
| Item | Value |
|---|---|
| Write API | POST <VICTORIA_METRICS_URL>/api/v1/import (newline-delimited JSON) |
| Metric name | __name__ = the sanitized metric name |
| Labels | device_id, topic (default when absent), unit, metric_id, plus every entry in labels |
| Read API | GET /api/v1/query_range with a PromQL selector, e.g. {__name__=~"cpu_usage", device_id="DEV-1234", topic=~"agent"}. Label values are escaped. |
| Connection | VICTORIA_METRICS_URL (e.g. http://victoriametrics:8428) |
When VICTORIA_METRICS_URL isn't configured, metrics fall back to the Elasticsearch index
getapp-metrics.
Deployment (Helm)
The stack is optional and disabled by default in
getapp-release-control/helm-chart/values.yaml:
| Values key | Purpose |
|---|---|
elasticsearch.enabled | Log store. Sets ELASTICSEARCH_NODE. |
kibana.enabled | Optional. Telemetry data views and dashboards are provisioned automatically. |
victoriametrics.enabled | Metrics store. Sets VICTORIA_METRICS_URL. retentionPeriod defaults to 90d. |
grafana.enabled | Optional. The VictoriaMetrics data source and dashboards are provisioned automatically. |
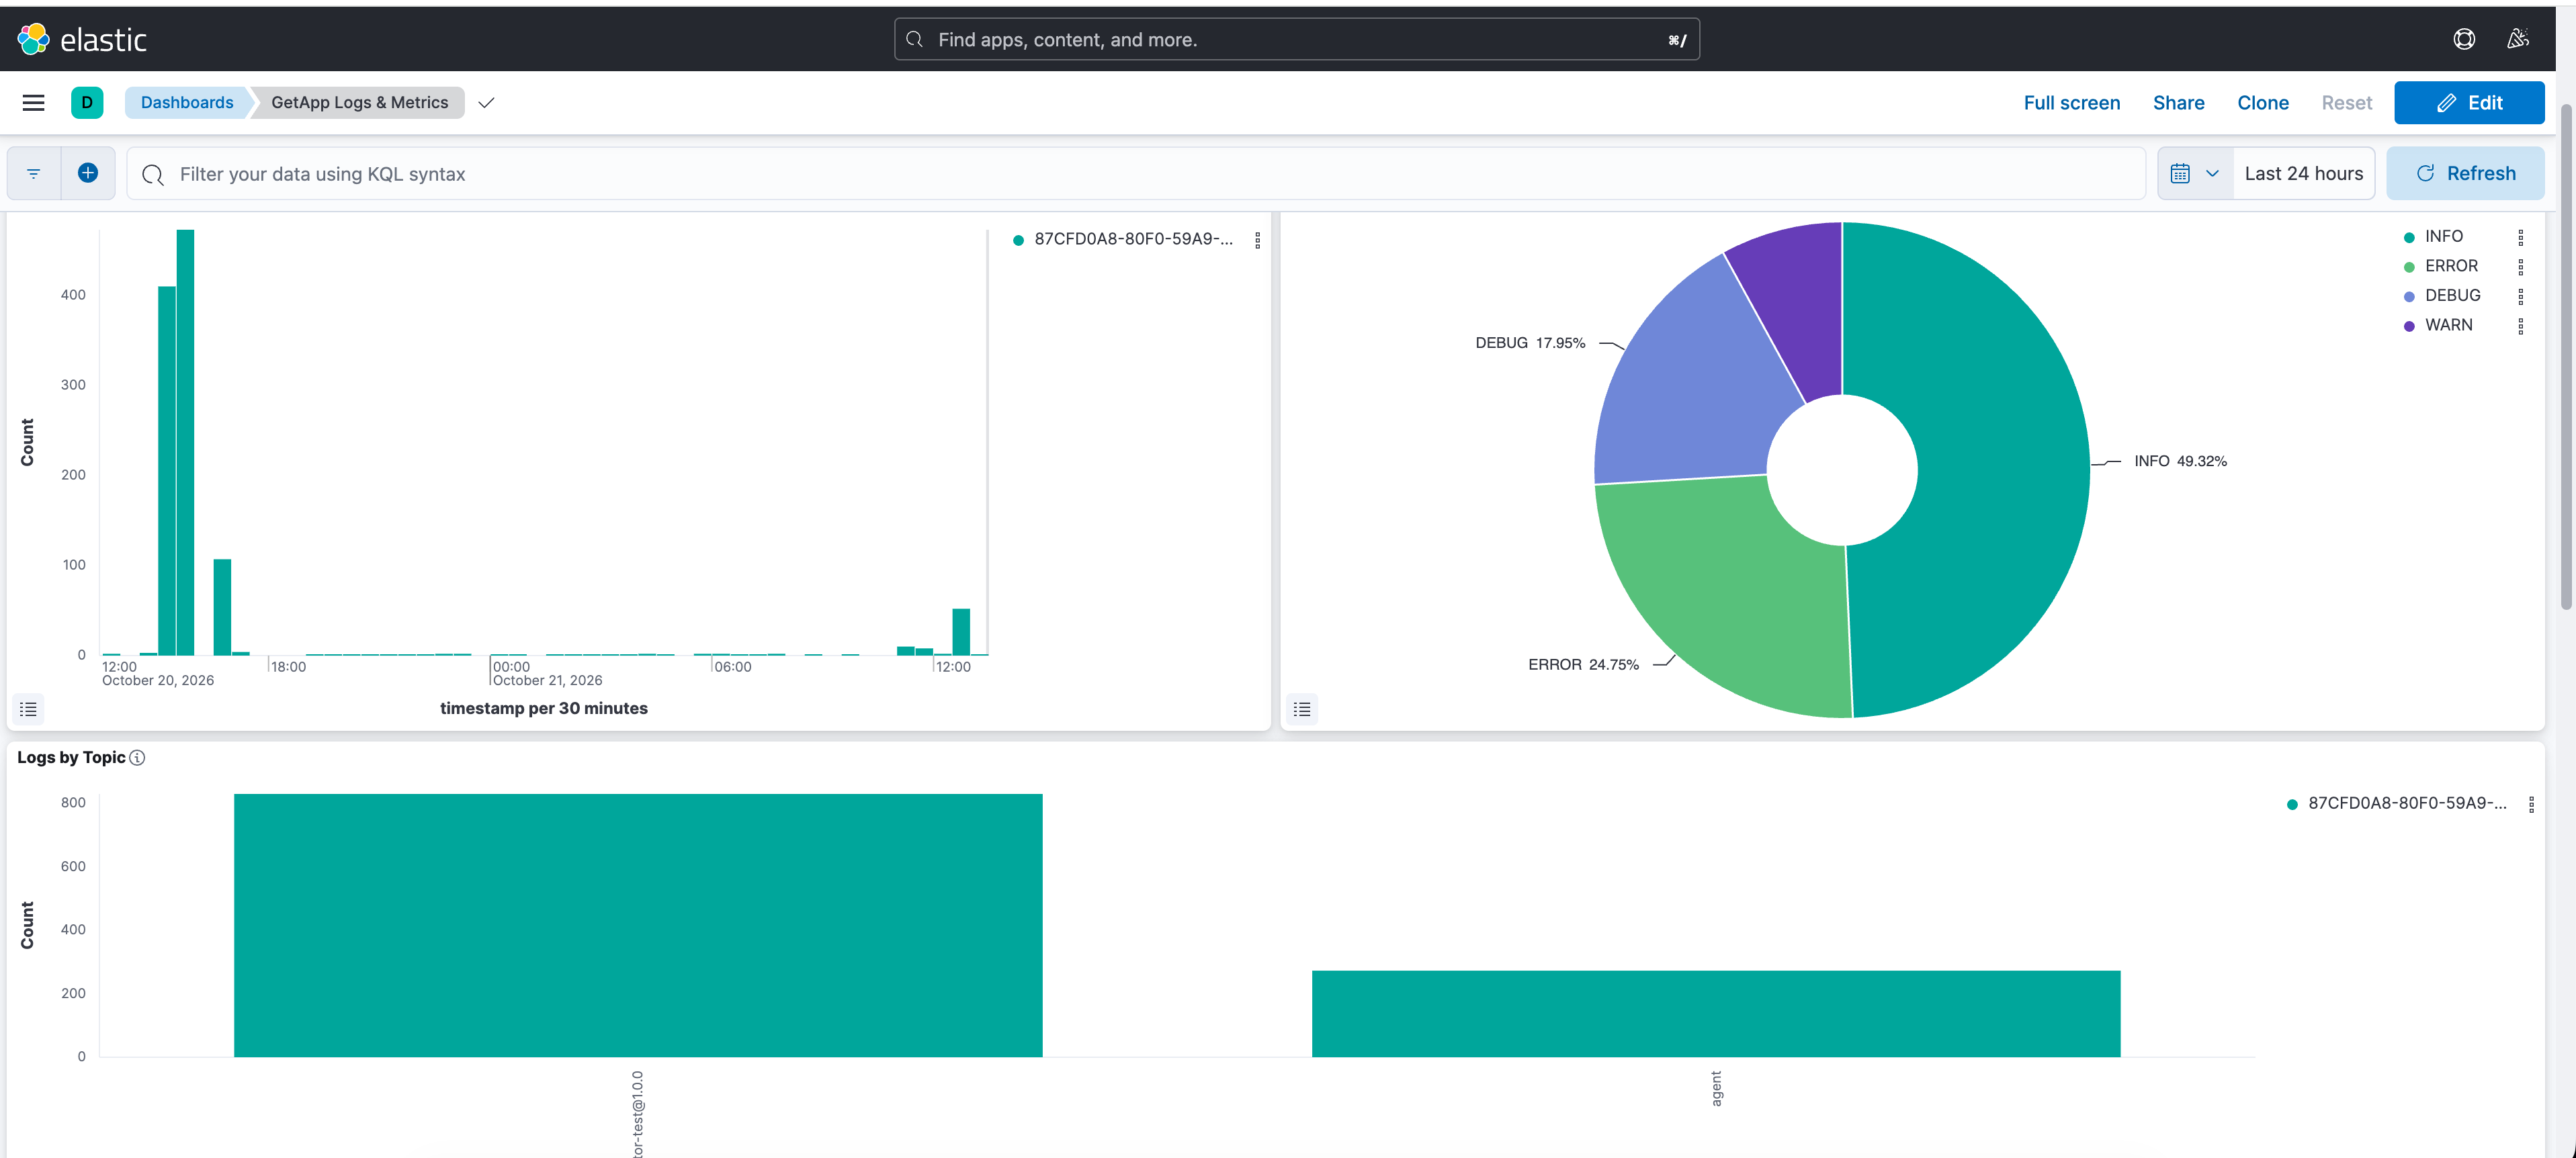
The automatically provisioned GetApp Logs & Metrics Kibana dashboard shows log volume over
time, the split by level, and log counts per topic. Component catalog ids appear next to
agent:
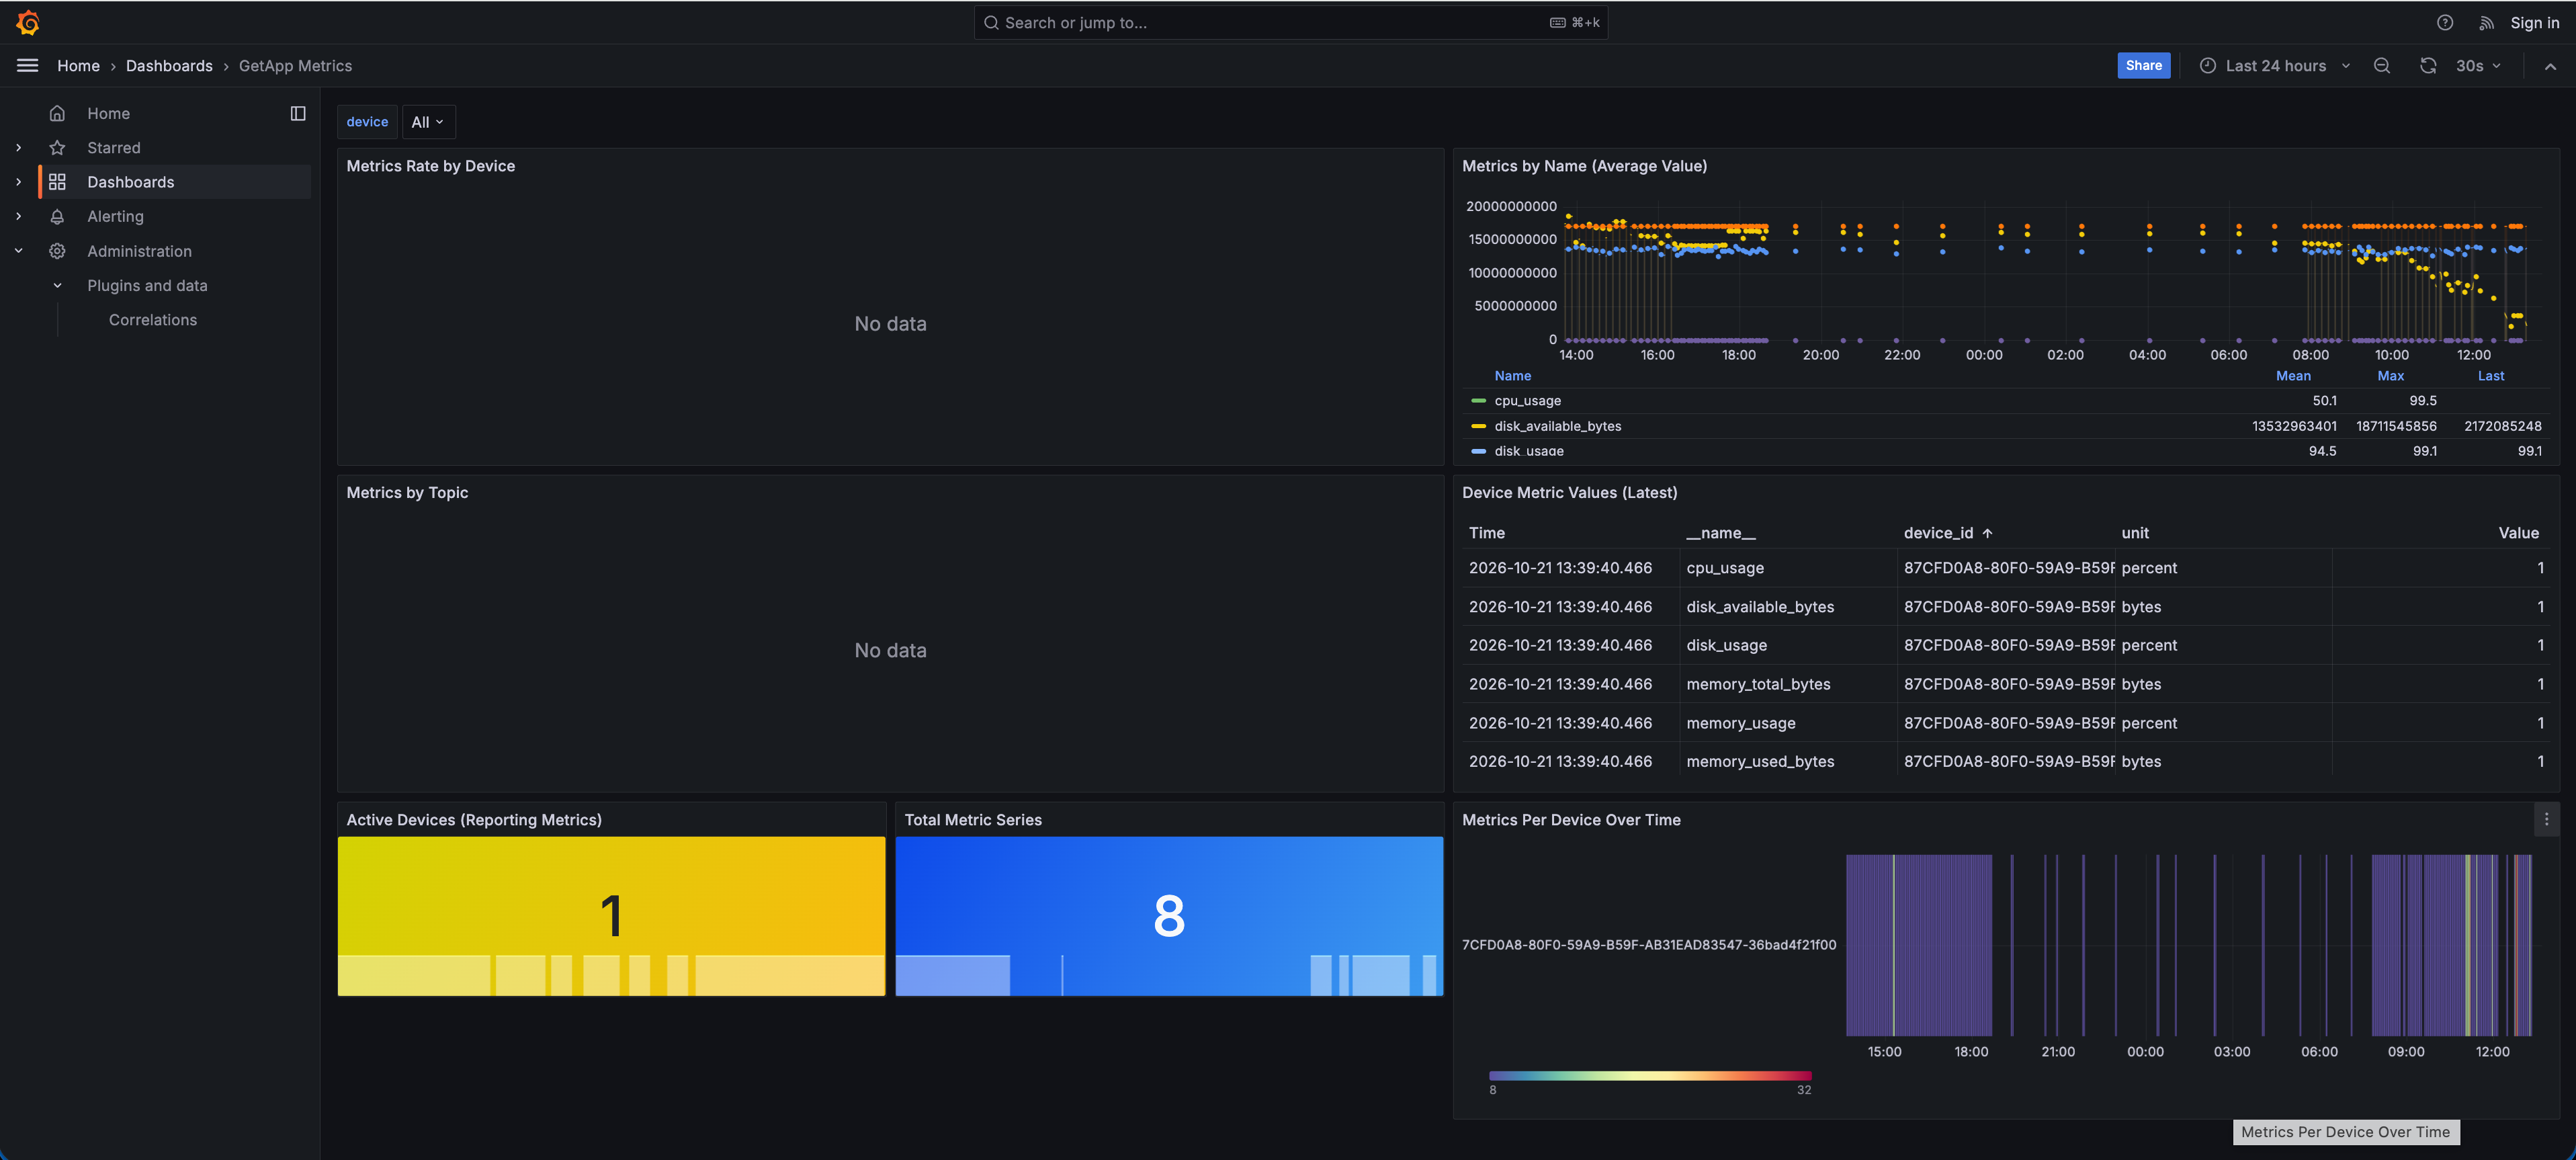
The GetApp Metrics Grafana dashboard reads from VictoriaMetrics and can be filtered by device:
5. Viewing logs in GetApp Platform
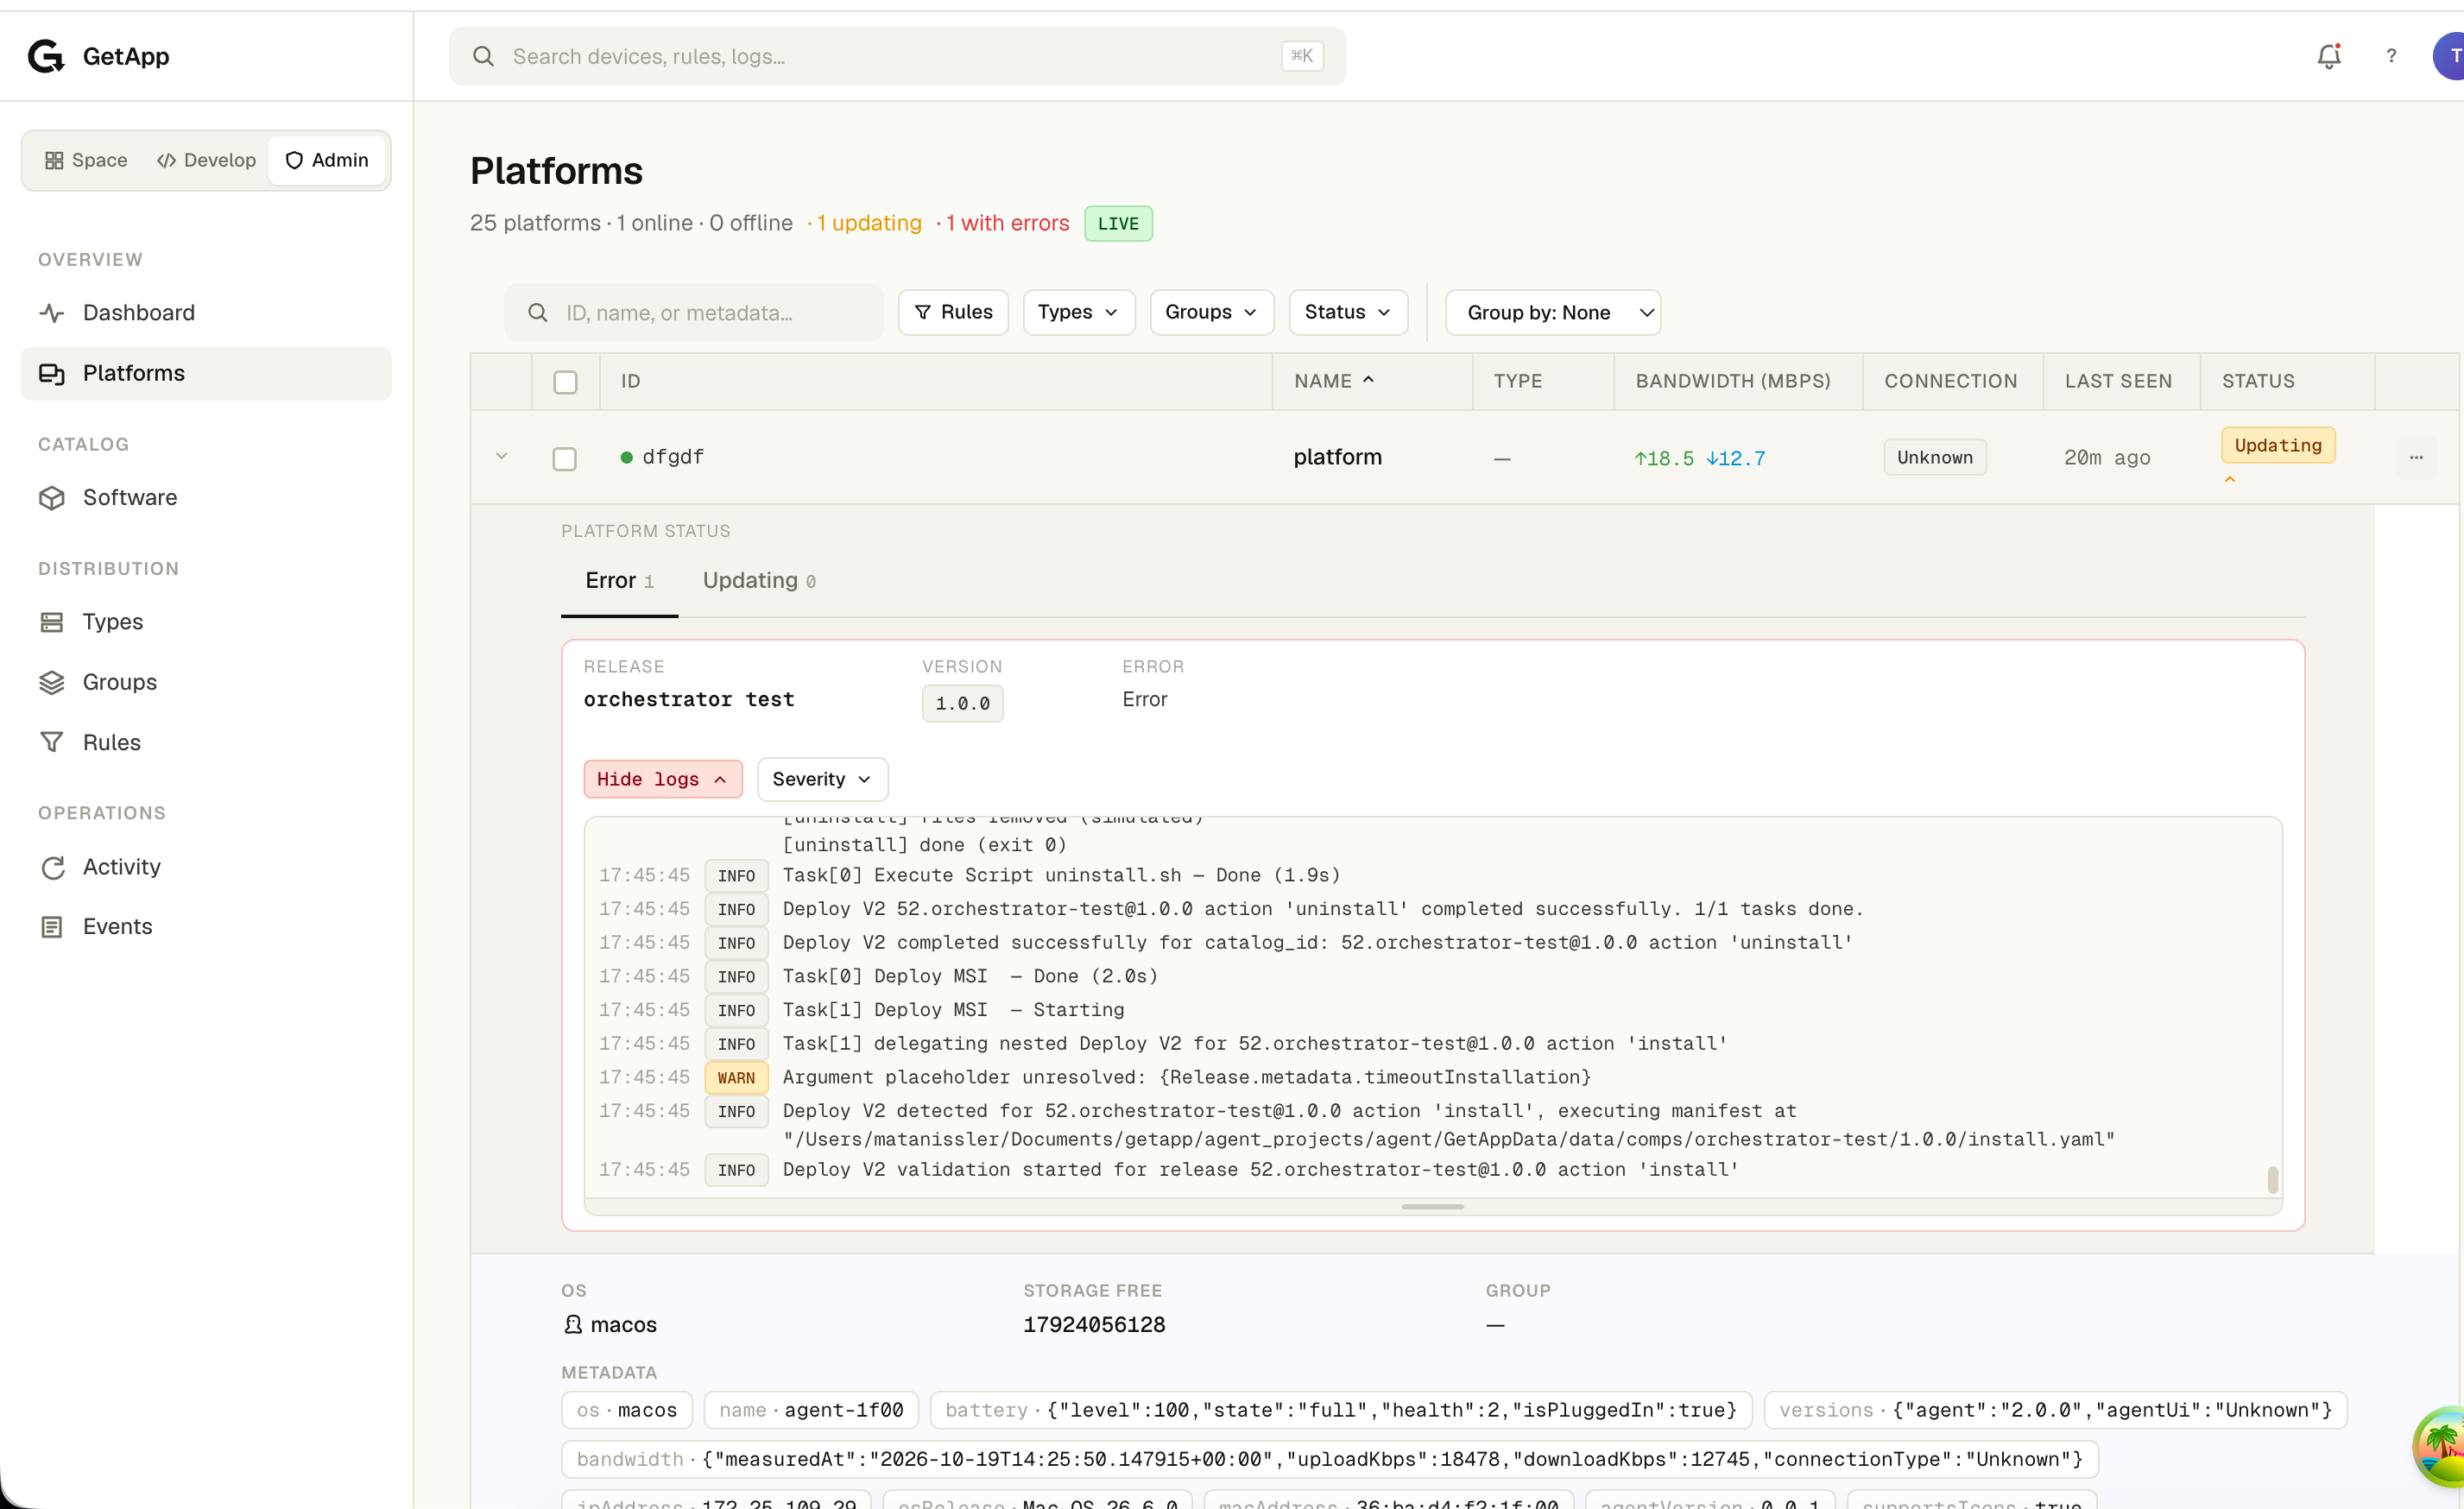
When a component is being installed, or has failed, on a device, GetApp Platform shows its deployment logs inline:
- Open Platforms, expand a device row, and open the Platform Status panel.
- In the Updating or Error tab, each component that has logs shows a Show logs button.
- Expand it to see the log history with a severity filter. New lines append live at the bottom.
How the UI fetches history
The panel (ComponentLogs) uses the component's catalog id as the topic and calls the
backend:
GET /api/v2/telemetry/logs?deviceId=DEV-1234&topics=52.orchestrator-test@1.0.0&levels=ERROR&levels=WARN&limit=100
Authorization: Bearer <user token>
| Query param | Description |
|---|---|
deviceId | Device to query |
groups[], topics[], levels[] | Optional filters |
search | Full-text match on message |
from / to | ISO-8601 time range. Defaults to the last hour. |
limit / offset | Paging. limit defaults to 100, maximum 1000. |
The API service forwards the request over Kafka (QUERY_LOGS) to the Deploy service. The
Deploy service runs a bool/must query on getapp-logs (term deviceId, terms topic,
terms level, match message, timestamp range), sorted by timestamp desc.
Metrics use the same pattern through GET /api/v2/telemetry/metrics (deviceId, topics[],
names[], from, to, step (default 60s), limit), which queries VictoriaMetrics
query_range. Both endpoints require the VIEW_METRICS role.
A probe query without filters decides whether to show the Show logs button. The button is hidden when the component has no logs.
6. Live logs with SSE
Live lines reach the browser over the existing alerts Server-Sent Events stream, with logs enabled:
GET /api/v2/alerts/stream?deviceId=DEV-1234&logs=true&topic=52.orchestrator-test@1.0.0&severity=ERROR
Accept: text/event-stream
Authorization: Bearer <user token>
| Query param | Description |
|---|---|
deviceId | Only alerts and logs for this device |
logs=true | Opt in to log frames. Without it, the stream carries alerts only, which keeps older clients working. |
topic[], group[], severity[] | Log filters (repeated or comma-separated) |
Each frame has an SSE event type of alert or log:
event: log
id: 8f0c…
data: {"deviceId":"DEV-1234","group":"agent","logId":"8f0c…","timestamp":"2026-10-21T10:15:02.120Z","level":"INFO","message":"Task 3/7 'install-service' completed","topic":"52.orchestrator-test@1.0.0","metadata":{…}}
The stream requires the VIEW_LOGS role.
End-to-end flow
How GetApp Platform consumes the stream
- One connection per device.
DeviceStreamProvider(contexts/DeviceStreamContext.tsx) keeps a single/api/v2/alerts/stream?deviceId=…connection per device, shared by the Events drawer (alerts) and every open log panel. When the first log panel subscribes, the connection is reopened withlogs=trueand the union of the requested topics and severities. When the last log panel closes, it returns to alerts-only. - Fetch-based SSE. The stream is read with
fetch()and aReadableStreamreader instead ofEventSource, so theAuthorization: Bearerheader can be sent. Frames are split on blank lines and routed by theirevent:line. - Per-panel routing.
useComponentLogStreamregisters a subscriber for(deviceId, topic, severities). Each incoming log frame goes only to the panels it matches. - Merge and de-duplicate. The panel merges the fetched history with live frames by
logId, sorts them oldest to newest, keeps the last 500 live lines, and auto-scrolls. The subscription starts as soon as the component has logs, even before Show logs is expanded, so no lines are missed. - Token refresh. When the user token changes, every device stream reconnects with the new token.
Live display depends on the device sending in reactive mode. In scheduled mode, the SSE
stream receives the lines only when the next dispatch runs (every send_interval_mins).
Troubleshooting
| Symptom | Check |
|---|---|
| No Show logs button | telemetry.logs_enabled is true on the device. A deploy log exists under <logs_dir>/deployments/. The logs are from the last hour (the default query window). |
| Logs appear only after a long delay | telemetry.reactive_mode is false, or the device is offline. Check the agent log for Reactive telemetry: messages. |
Third-party INFO lines missing on the server | telemetry.log_min_level (default ERROR) filters them at send time |
Server logs Elasticsearch is not configured … dropping | ELASTICSEARCH_NODE isn't set (elasticsearch.enabled: false in Helm) |
| Metrics missing in Grafana | VICTORIA_METRICS_URL isn't set. Metrics then go to the getapp-metrics index in Elasticsearch instead. |